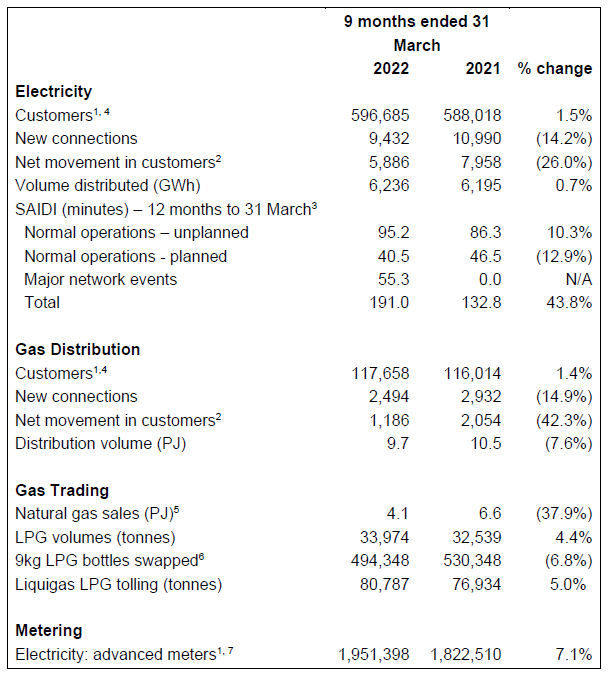
Operational performance highlights:
- 596,685 electricity network connections, up 1.5% on March 2021
- 117,658 gas network connections, up 1.4% on March 2021
- 7.1% growth of advanced meter fleet since 31 March 2021 (total of 1,951,398 now installed across Aus/NZ)
- More than 468,000 advanced meters now installed in Australian market
Commentary:
The nine months to 31 March 2022 have seen Auckland’s growth continue, with network connection numbers growing across Vector’s electricity and gas networks. In the year to 31 March 2022, total electricity connection numbers grew by 1.5%, however, new electricity connections in the nine months to 31 March 2022 were down 14.2% on the same period last year reflecting the impact of COVID-19 restrictions in Auckland. Electricity distributed volume for the period was up 0.7% compared with the nine months ended 31 March 2021. Residential volumes were up 5.9% while SME/I&C volumes were down 1.4%.
In line with expectations, there has been a 1.4% increase in total connections on Auckland’s gas distribution network over the 12 months to 31 March 2022. However, new gas connections in the nine months to 31 March 2022 were down 14.9% on the same period last year reflecting the impact of new developments not connecting to gas amid uncertainty over the Government’s response to the Climate Change Commission’s recommendations. Gas distribution volume for the nine months to 31 March 2022 was down 7.6% compared with the same period in 2021, driven by lower consumption of gas and reduced activity from the industrial and commercial sectors.
Vector’s metering business continues to perform in an increasingly competitive market both here and in Australia. Connection numbers increased by 7.1% in the year to 31 March 2022, with a total fleet of 1,951,398. We have now installed more than 468,000 advanced meters in Australia.
BottleSwap has seen a 6.8% decrease in the number of 9kg bottles swapped in the nine months to 31 March 2022 compared with the same period last year. BottleSwap volumes have been negatively impacted by COVID-19 alert level restrictions.
Natural gas volumes are down 37.9% on the March 2021 comparative period, with the reduction driven by lower sales including the loss of a large customer in June 2021. Liquigas LPG tolling volumes are up 5.0% on the March 2021 comparative period due to higher customer demand.
Total SAIDI minutes for the twelve months ended 31 March 2022 are unfavourable compared to last year due to outages driven by extreme weather conditions. However, these are still within the regulatory threshold by 9% and notably favourable compared to earlier years. The major network events SAIDI minutes were 55.3 minutes higher due to the impact of Cyclone Dovi in February and Auckland storm events in early August. These results are preliminary and subject to audit.
While COVID-19 has impacted Vector’s business operations during the nine months ended 31 March 2022, Vector has continued to work to minimise the impacts of COVID-19 to its operations and the safety and wellbeing of its staff in both New Zealand and Australia.

1. As at 31 March.
2. Net number of customers added during the period, includes disconnected, reconnected, and decommissioned ICPs.
3. SAIDI (minutes) for the 12 months ended 31 March 2022 is an unaudited value and subject to change.
4, Billable ICPs.
5. Excludes gas sold as gas liquids.
6. Number of 9kg LPG bottles swapped and sold during the period.
7. The number of advanced meters as at 31 March 2022 includes 181,991 meters managed but not owned by Vector (31 March 2021: 175,058).
ENDS