Customer focus driving change
Vector enabling customer choice and driving industry transformation by embracing new technologies. Growth in Auckland and metering services lifts financial performance.
HIGHLIGHTS:
-
Sale of Vector Gas1 results in gain on sale of $164.1 million and releases capital to repay debt and ultimately redeploy into new growth opportunities
-
Adjusted EBITDA2 from continuing operations3 (that is, excluding Vector Gas) rises 4.7% to $473.0 million from $451.9 million as Vector benefits from growth in Auckland and metering and strong cost control across its regulated businesses, off-set by a decline at Gas Trading
-
New Zealand smart meter fleet reaches 1,126,258 and Vector installs its first smart meters in Australia after receiving Australian Energy Market Operator accreditation earlier in the financial year
-
Installed a 1 MW Tesla Energy network battery in Glen Innes and installed 78 Tesla Powerwall batteries with the support of majority shareholder Entrust
-
Well-signalled non-cash write-down in Gas Trading goodwill of $64.0 million reflects outlook for natural gas operations, and in particular declining output from Kapuni and diminishing prospects of further field development due to ongoing disputes
-
Net profit for the year of $274.4 million, up 84% from $149.4 million in the prior year, lifted by increased operating earnings, lower interest costs, favourable derivative movements and the $164.1 million gain on the sale of Vector Gas, partially offset by the write down in the value of the Gas Trading business
-
Our Total Recordable Injury Frequency Rate (TRIFR)4 for the year to 30 June 2016 increased 7.9% to 8.04, but remains more than 40% below 2013 level
-
Full year dividend increases for tenth consecutive year to 15.75 cents per share after fully-imputed final dividend declared of 8.0 cents per share. The record date for dividend entitlements is 8 September 2016 and the payment date is 15 September 2016
- Vector expects adjusted EBITDA5 for the year to 30 June 2017 to be between $460 million to $475 million
New Zealand’s leading energy infrastructure company Vector today reports improved earnings from continuing operations for the 12 months to 30 June 2016 as it benefits from growth in Auckland and the expansion of its smart meter fleet.
The company continues to prioritise growth in its portfolio, both from its existing assets, and from the new opportunities emerging with advances in new energy technologies.
Over the last year it sold Vector Gas, which owned the gas transmission and gas distribution assets outside Auckland, for $952.5 million6 as it sought to refocus its regulated investment into its rapidly growing Auckland energy networks.
It also installed a record 180,842 smart electricity meters across the country. This took the total smart meter fleet to over 1.1 million. Building on its market leading position in New Zealand, it also signed its first metering services contract and installed its first smart meters in Australia.
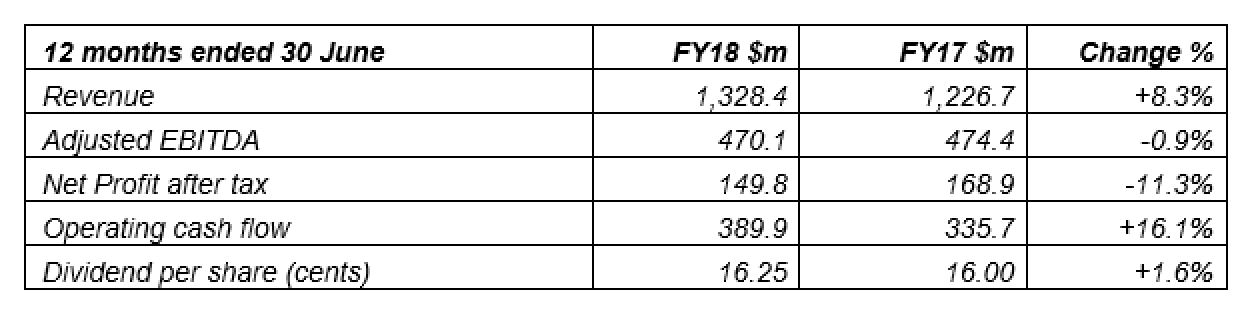
Net profit rose 84% to $274.4 million from $149.4 million, lifted by increased operating earnings, lower interest costs, favourable derivative movements and the $164.1 million gain on the sale of Vector Gas, partially offset by a $64.0 million non-cash write down in the value of the Gas Trading business.
Group revenue from continuing operations (that is, excluding Vector Gas) fell 0.8% to $1.14 billion from $1.15 billion due primarily to a reduction in Gas Trading volumes as well as lower electricity transmission charges that are passed directly through to customers.
Adjusted EBITDA from continuing operations rose 4.7% to $473.0 million from $451.9 million. This figure excludes the contribution from Vector Gas through to its sale on 20 April 2016. Absent the Vector Gas sale, adjusted EBITDA would have been at the top end of market guidance7 of $550 million to $565 million.
Adjusted EBITDA8 for the continuing regulated networks business (that is, excluding Vector Gas) increased by 5.4% to $368.5 million from $349.7 million. Growth in Auckland and a strong focus on cost control continues to support earnings at the regulated energy networks and offset a continuing decline in average household power consumption.
The company added 11,849 new connections to its Auckland energy networks, up 11% on the prior year. Total electricity connections were up 1% to 550,053, while total gas connections grew 2.7% to 104,322.
Adjusted EBITDA in the unregulated businesses rose 1.1% to $154.1 million from $152.4 million. An improved contribution from Vector Communications and ongoing growth in the New Zealand metering business offset challenges at the Gas Trading business and costs associated with the expansion into Australia and the commercialisation of new technologies.
Vector Chairman Michael Stiassny said: “We are excited by the opportunities afforded by new energy technologies. We have now installed more than 1.1 million smart electricity meters in New Zealand and we are now looking to leverage our capabilities in Australia.
“With the support of our majority shareholder, Entrust, we have rolled out a network of electric vehicle (EV) chargers across Auckland. We have installed 78 Tesla Powerwall batteries across our network.
“We have installed a 1 MW Tesla Powerpack battery in Glen Innes. And we have achieved all of this while delivering improved earnings and returns to shareholders.
“We are creating a new energy future. Critical to achieving this goal is a culture that prioritises safety, nurtures innovation and new ideas, and actively encourages diversity and inclusion.
“We were pleased this year, for instance, to be recognised with the Rainbow Tick certification, given to companies that can demonstrate that they understand, value and welcome sexual and gender diversity.
“We are championing New Zealand’s efforts to create safer workplaces. We welcome the new Health and Safety at Work Act 2015. We have ceased most live-line work, in a move aligned with Vector’s aim to lead the way on safety by taking all practicable steps to protect the health and safety of our people.
“Our Total Recordable Injury Frequency Rate (TRIFR) for the year to 30 June 2016 increased 7.9% to 8.04 but has reduced by an average of 17.0% annually since the end of the 2013 financial year.
“We signalled in February a review of the carrying value of the Gas Trading business. We have now written down this value to reflect the steady decline in the output from the Kapuni field, the diminishing prospects of further field development due to ongoing disputes, and weak international hydrocarbon prices. The write down is a non-cash accounting adjustment that has no impact on the financial strength of Vector.
“The sale of Vector Gas has further strengthened our balance sheet. As a result of the sale, Vector’s gearing as at 30 June 2016 fell to 43.7%, down from 53.6% a year ago and 53.4% at 31 December 2015. The proceeds from the sale of Vector Gas will be applied initially to debt reduction, before redeployment to support growth in Auckland, smart metering and new energy technologies.
“Our investment in our Auckland energy distribution networks will be linked to the regulatory regime’s recognition of the special challenges we face with Auckland growth and the rising risks - due to advances in new technology - that new investments could be made redundant before they have delivered a return.
“We are engaging constructively with regulators and policymakers over these issues. Indeed, the Commerce Commission, as part of its review of the regulatory regime ahead of the next regulatory resets for the gas and electricity businesses, is recognising these challenges.
“Vector has increased its dividend for the tenth year running to 15.75 cents per share from 15.5 cents in the prior year, after the board declared a fully-imputed final dividend of 8.0 cents per share. The record date for dividend entitlements is 8 September 2016 and the payment date is 15 September 2016.
“This dividend represents a pay-out of 75% of free cash flow9 and is ahead of our policy to target a pay-out of 60%. As signalled in February, the board is reviewing whether a higher target is appropriate.
“Vector is proud of the successes of the last year. We are looking forward to the remainder of this financial year with confidence and expect adjusted EBITDA10 for the year to 30 June 2017 to range between $460 million and $475 million,” Mr Stiassny said.
RESULTS SUMMARY
Vector Group Chief Executive Simon Mackenzie said: “We are providing new energy choices to customers by taking advantage of new technologies, even though this may disrupt long-established value chains in the energy sector.
“We are evolving our networks to deliver the benefits that smart meters, highly efficient and cost-effective solar panels, batteries, electric vehicle charging infrastructure and energy management services offer to customers.
“The future is unpredictable. New business models are evolving in response to new customer demands and these new technologies. We have taken the strategic decision to embrace these changes rather than resist them.
“We see the new environment as an opportunity to work with providers of new business solutions and products. We will not always get it right, but we cannot afford to stand still as some others in the sector appear to be doing.
“We approach this new environment from a strong position. Our networks, due to their growth prospects, are highly sought after by international investors. They are essential infrastructure for our communities and the economy. For those of our customers with solar generation, they provide access to grid power when the sun doesn’t shine and enable customers to export excess power back to the grid or, in future, the option to share it with neighbours.
“They enable customers with electric vehicles or those equipped with batteries to store power generated in the middle of the night, when significant latent electricity-generating capacity depresses prices. They also serve the long-term interests of customers by giving them access to new and innovative retail offers that seek to take advantage of wide variations in energy pricing.
“The challenge for Vector is to continue to demonstrate to customers the continuing important role for the network, the value these new solutions deliver and ensure any new investment takes account of the risks and opportunities of this industry transformation.
“These risks – that investments could be made redundant before they have delivered a return – are particularly acute in Auckland, where significant investment is required to meet customer demand for infrastructure.
“We are well accustomed to such change. Our bottle swap business is thriving. Since acquisition in 2011 this business has delivered a compound annual growth in 9 kg bottle swap volumes of 15.2%. In the year to 30 June 2016, swap volumes reached 549,998 bottles, up from 505,927 in the prior financial year.
“Only a few years ago this business did not exist. By recognising early a change in customer preferences towards swapping bottles over refilling, Vector has been able to carve out a strong position in this market, whilst protecting itself from the decline in sales of LPG at fuelling stations.
“Similarly, Vector was among the first to identify the benefits new smart meter technologies offered to customers and energy retailers. In under a decade we have grown to become a New Zealand leader in the provision of these services.
“We have made significant strides in the current year. We installed a record number of smart meters in New Zealand. After receiving Australian Energy Market Operator accreditation, we signed our first metering services agreement with a major Australian electricity retailer in May this year.
“We are well positioned to make the most of the considerable potential we see across the Tasman, not least because the move builds on our position as a leading provider of advanced metering services in New Zealand, where we now operate a total fleet of nearly 1.5 million gas and electricity meters.
“This year, we were among the first customers outside of the US to take delivery of Tesla batteries, which we are now deploying across our network.
“In Glen Innes, east Auckland, we have installed a Tesla utility-scale Powerpack battery.
“It will allow Vector to continue to provide a secure power supply and defer the significant investment required for a new substation while we assess the effects of trends in the area such as declining household power consumption, renovation and infill housing, and the uptake of new energy solutions.
“We have installed 78 Tesla Powerwall batteries on the network, mainly to the winners of the Future of Energy competition, which - with the support of our major shareholder, Entrust - is giving deserving schools, community groups and families free use of a solar and battery system for 10 years.
“These installations are providing Vector with valuable insights into how customers use the technology, the systems' technical requirements and the potential of batteries and solar panels to deliver savings on our customers’ energy bills.
“We have also made significant advances in the provision of EV charging infrastructure. With the support of Entrust, we have installed 16 chargers across Auckland including 10 rapid chargers, which can charge an average EV’s battery to 80% of capacity in around 20 minutes.
“Reflecting our determination to put customers at the centre of our business and improve the customer experience, we have set up a new customer excellence group to oversee key interfaces with customers, including customer communications, gas and electricity connections and network provisioning. The aim is to ensure Vector delivers services easily and quickly or - in the shorthand of the group - ‘easyfast’.
“At the heart of this group’s efforts is the development of online self-service tools for network provisioning, fault reporting and updates on the progress of customer requests including fault resolution.
“These programmes are building on the success of the Vector outage app and the online gas connection estimator. The outage app is one of the first ports of call for customers for fault information, while the estimator, launched last year, has reduced the time for a residential gas connection quote from five days to just a few seconds.
“We are also advocates for the Auckland region and customers. This in part reflects our majority ownership by Entrust, which holds shares in Vector on behalf of approximately 320,000 Auckland electricity consumers. It also reflects our determination to lead change in the sector.
“We are, for example, strongly arguing against the Electricity Authority's (EA) proposals for Transpower's transmission network charges. These proposals will see Aucklanders paying an extra $78 million annually to meet their energy needs and major electricity generating companies sharing less of the burden.
“The EA’s proposals will have no financial impact on Vector, because transmission charges are passed directly on to customers, but we object because the proposals are contrary to the EA’s goal to ensure all who benefit from Transpower's grid pay their fair share.
“Vector meanwhile continues to work closely with Auckland Council on the challenges facing the region. Together we are planning a range of initiatives in the coming year to deliver new energy solutions into the community. The Council is also an important customer of Vector Communications and vegetation management company Treescape, in which we are a 50% shareholder.
“We have continued to work hard to improve our service quality. We consistently meet the Commerce Commission requirements for System Average Interruption Frequency Index (SAIFI), which measures the number of times customers are affected by an outage. However, in each of the last three regulatory years our System Average Interruption Duration Index (SAIDI) measure, the duration of interruptions per customer, has exceeded the Commerce Commission’s quality threshold.
“The SAIDI performance reflects, in no small measure, changes in our operating environment. Increasing traffic congestion in Auckland has made it harder for our crews to get to the site of faults. Meanwhile, new health and safety practices, such as our cessation of most live-line work is also extending the duration of outages. We are working with the Commerce Commission on these issues.
“Vector is looking to the future confidently. We are driving energy industry transformation by providing choice for customers and working with like-minded businesses that are embracing the new opportunities emerging in the sector.
“Vector is grateful to the efforts of our staff and contractors over the last year. It is thanks to their efforts that we have been able to give our customers greater choice and control over their energy use. We are creating a new energy future,” Mr Mackenzie said.
SEGMENT RESULTS
UNREGULATED BUSINESSES:
TECHNOLOGY: Smart meter roll out continues to drive growth but establishment costs in Australia and business development expenditure dilute gains
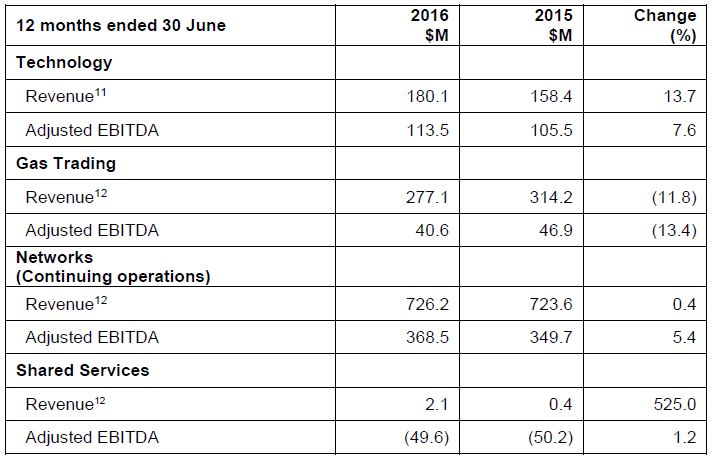
Technology division revenue rose 13.7% to $180.1 million from $158.4 million a year earlier driven largely by increased deployment of smart meters (including the first full-year contribution from Arc Innovations).
Adjusted EBITDA rose 7.6% to $113.5 million from $105.5 million. Gains from the smart meter roll out were diluted by significant business development expenditure associated with new energy technologies and the establishment of the Australian metering operation.
The division benefited from a significantly higher installed smart meter base, up 17.5% to 1.13 million from 958,146 in the prior year.
The company is reaching the end of the New Zealand smart meter roll-out. We are targeting the deployment of 140,000 to 160,000 meters over the next 12 months. Thereafter, the focus in New Zealand will be on managing the existing electricity meter fleet and installing new and replacement meters as required.
Vector is targeting Australia to deliver the next phase of growth for the metering business. Following our Australian accreditation earlier this year, we have also this year executed our first metering services agreement with a large Australian retailer.
Meanwhile, Vector Communications has delivered an improved result and continues to grow its market share within its network footprint. It is in a strong position to provide high-end telecommunications solutions to its customers. This year Vector Communications entered into a contract to supply connectivity to all Auckland Council offices across the city.
GAS TRADING: Challenging trading environment continues
Revenue at the Gas Trading division fell 11.8% to $277.1 million from $314.2 million a year earlier as the division faces a challenging trading environment. Adjusted EBITDA fell 13.4% to $40.6 million from $46.9 million.
Natural gas volumes continued to decline, falling 14.4% to 16.7 PJ from 19.5 PJ due to a reduction in demand from gas fired electricity generators and the end to some entitlements to Maui gas.
Continued weakness in the price for natural gas in New Zealand has weighed on margins. Additionally, adjusted EBITDA was impacted by lower production and processing fees at the Kapuni Gas Treatment Plant and lower hydrocarbon prices.
We signalled in February a review of the carrying value of the Gas Trading business. We have now written down the carrying value by $64.0 million to reflect the steady decline in the output from the Kapuni field, the diminishing prospects of further field development due to ongoing disputes, and weak international hydrocarbon prices.
Despite the uncertainty surrounding our natural gas activities, Vector’s LPG operations occupy a strong market position. Bottle swap volumes continued to grow, supporting our decision to invest in a new bottling facility. Volumes of 9 kg bottles were up 8.7% to 549,998.
Liquigas continues to make a strong contribution, despite a 7.5% decline in tolling volumes to 172,695 tonnes, largely due to fewer exports, as lower international prices made exports less attractive.
As previously disclosed, Vector received an arbitral award regarding the price and terms for the next tranche of Kapuni gas which we have been taking since July 2013. The award was broadly in line with our expectations.
REGULATED BUSINESSES: Auckland continuing to deliver connection growth
Following the sale of Vector Gas, the company has combined the Auckland gas and electricity distribution businesses into a single segment for reporting purposes.
The division’s revenue from continuing operations (that is, excluding Vector Gas) for the year grew by 0.4% to $726.2 million from $723.6 million in the prior year. A decline in pass through charges due to lower transmission fees was offset by a 21.6% increase in capital contributions, reflecting connection growth and the significant infrastructure development taking place in Auckland.
Adjusted EBITDA from continuing operations rose 5.4% on the prior year to $368.5 million from $349.7 million on the back of lower segment expenses (excluding pass through costs), which fell $16.7 million. These lower costs were due to ongoing cost reductions and a combination of provision releases and one-off costs in the prior year.
New electricity connections rose 9.1% to 8,526 from 7,813. New gas connections rose 18.0% to 3,323 from 2,821. Total connections to the network at the end of the year stood at 550,053, up 1.0% from 544,513 a year ago. Total gas connections to the network at year end stood at 104,322, up 2.7% from 101,565 a year ago.
Despite the increase in connections, volumes transported across the electricity network fell 0.5% to 8,372 GWh from 8,414 GWh, due to the effects of warmer weather, the partial closure of a large commercial customer and continuing declines in average electricity consumption per residential connection. Auckland gas distribution network volumes rose 3.7% to 13.9 PJ from 13.4 PJ in the prior year due largely to an increase in new connections.
DISCONTINUED OPERATIONS:
The group’s Gas Transmission and non-Auckland Gas Distribution business was sold on 20 April 2016. As at that date, revenue less operating expenses were $79.1 million. In the prior year they earned $102.2 million for the full year. Net profit after tax but before gain on discontinued operations was $51.4 million. In the prior year net profit was $61.1 million.
CAPITAL EXPENDITURE
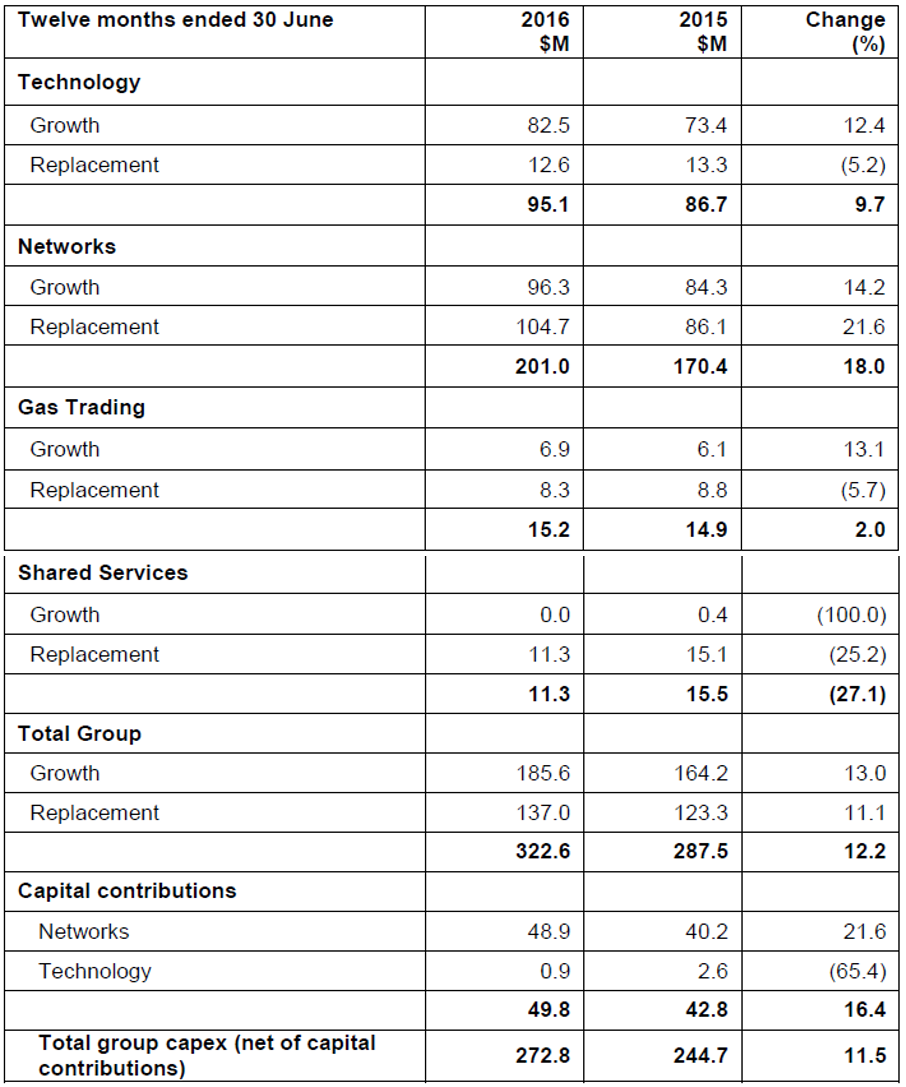
Overall capital expenditure for continuing operations (that is, excluding Vector Gas) is $322.6 million compared to $287.5 million in the prior corresponding period. The increase in capital expenditure was driven by growth in Auckland, higher metering deployments and additional replacement capital expenditure on the regulated network.
- Vector Gas owns gas distribution assets outside Auckland and a gas transmission network.
- Adjusted EBITDA is a non-GAAP profit measure. During the year we amended our definition of adjusted EBITDA to exclude capital contributions. For a comprehensive definition and reconciliation to the GAAP measure of net profit refer to page 12 of this release.
- For statutory reporting purposes, the Vector Gas businesses are presented separately in the profit or loss statement as discontinued operations. Please refer to our full-year financial statements for a breakdown of continuing and discontinued operations.
- A TRIFR of 8.04 is equivalent to 8.04 total recordable injuries for every million hours worked
- Excluding capital contributions.
- The sale of Vector Gas to First State Funds completed on 20 April for $952.5 million. On June 22 Vector received a fee of $7.5 million plus GST from First Gas Limited in relation to its successful acquisition of the Maui pipeline. As at 30 June 2016, the sale of Vector Gas remained subject to minor wash-ups in respect of working capital and capital expenditure.
- Assumes annualisation of the results from Vector Gas, rather than the actual contribution for the almost 10 months to 20 April.
- Unregulated and regulated adjusted EBITDA figures reflect the EBITDA of the three operating segments, excluding capital contributions.
- Defined as net cash flows arising from operating activities less replacement capital expenditure outflows
- Excluding capital contributions
- Includes Capital Contributions